Walk-Forward Backtesting vs Direct Optimization: A Complete Guide With Nifty 9:20 Straddle Strategy
This guide explains direct optimization, in-sample/out-of-sample testing, and walk-forward analysis using real data from 2019–2025. You will also see walk-forward results for the popular Nifty 9:20 straddle strategy built on Algotest and true forward-test performance for 2024–2025.

Most people do this when they are optimizing the trading strategy.
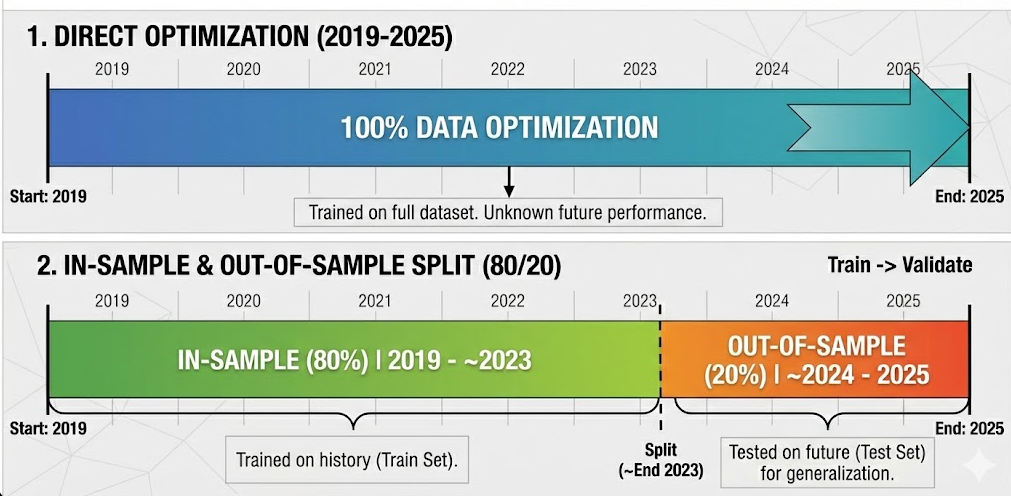
1. Direct Optimization
The first method is poor because you use all the data for optimization. You have no idea how it will behave in real trading. You go live with full excitement, and then it fails.
2. In Sample Optimization & Out of Sample Testing
The second method is better than the first because you use 80 percent of the data for in-sample optimization. After choosing the final parameters, you test them on the remaining 20 percent to check if the system is overfitted or able to work on unseen data. This gives more confidence than the first method. But if you repeat this many times, you end up using the whole dataset again, which makes it similar to the first approach.
3. Walk Forward Optimization
Now I want to show you a better method called walk forward optimization. I use this for all my trading strategies. Here is how it works.
Here is how it works:
- We have data from 2019 to 2025, but we do not use it all at once.
- First, we optimize on one year of data and test the results on the next three months. Then we shift the start date by three months, optimize again, and test again. In the end, we combine all the out of sample results to form the equity curve.
- For example, we optimize from Jan 2019 to Dec 2019 and trade the optimized parameters from Jan 2020 to Mar 2020. That is the first red block you see below.
- Next, we shift the in sample window by three months. So we optimize from Apr 2019 to Mar 2020 and trade those parameters from Mar 2020 to Jun 2020.
- We keep moving the window by three months, re-optimizing each time, and trading only with the new optimized parameters for the next three months.
Before doing this final test, we also adjust the parameter choices and their ranges during 2019 to 2023. Once these are fixed, we do not change anything from 2024 to 2025. That period acts as the real test.
So, this is what walk forward backtest periods from 2019 to 2024 looks like.
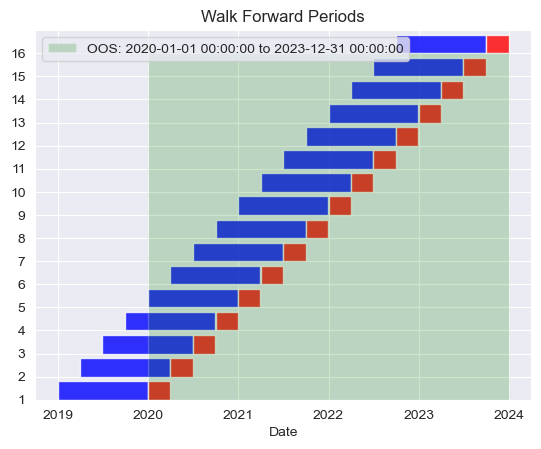
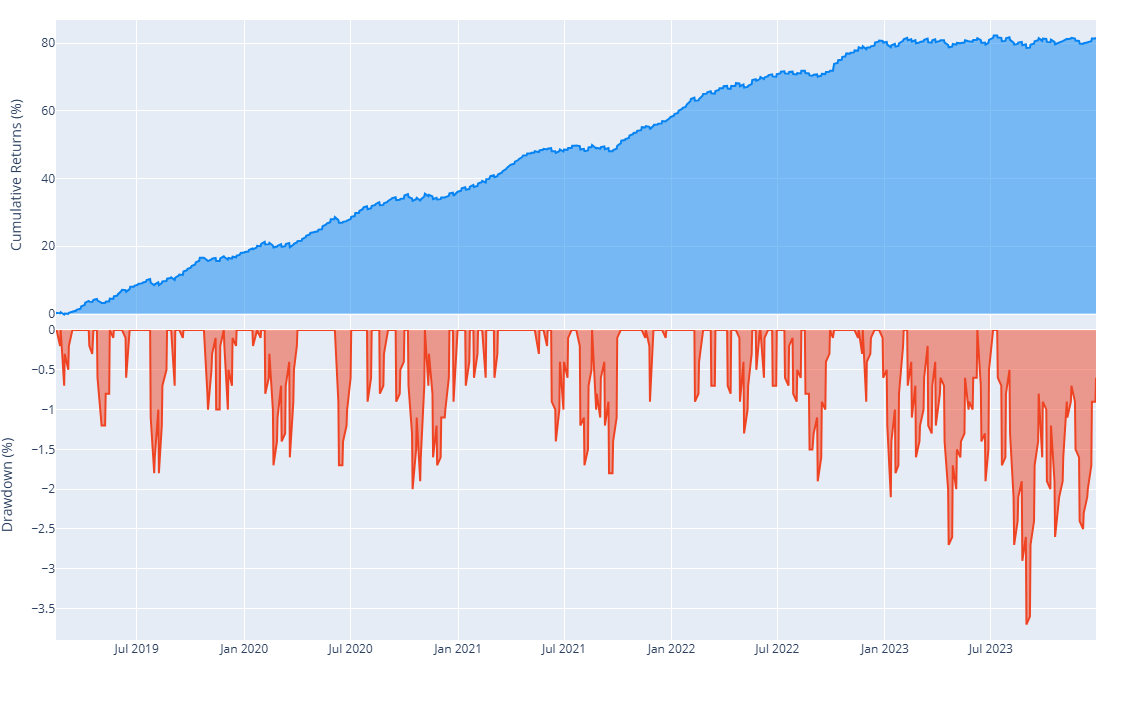
The chart below shows the combined equity curve for only the out of sample periods from all rows. This is the green shaded section in the top chart.
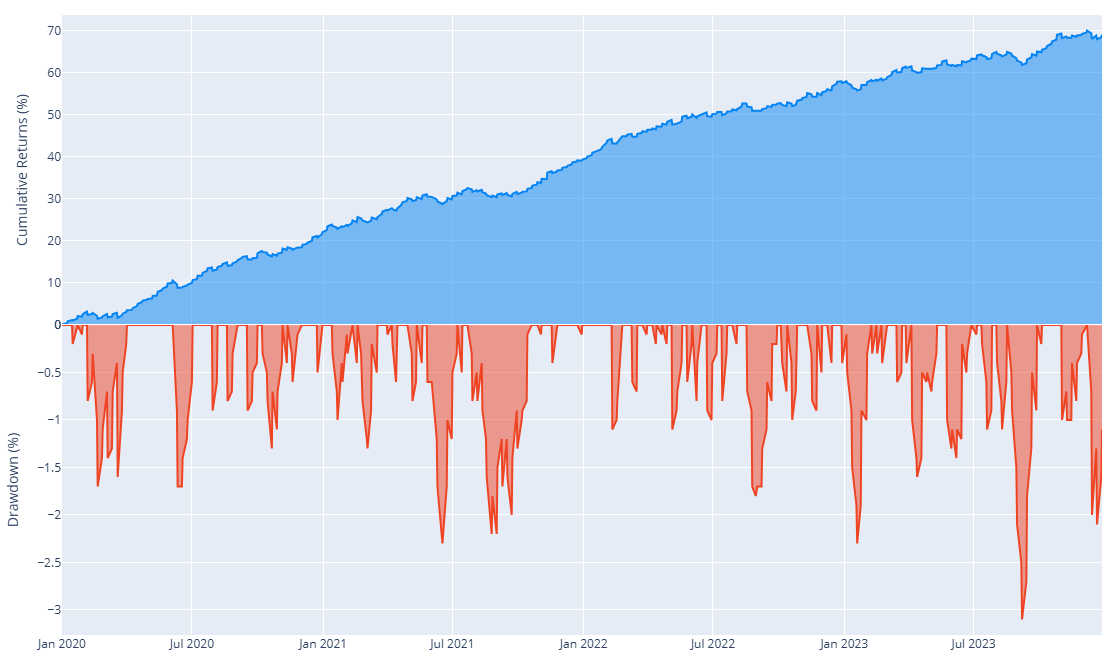
The two key benefits are:
- This curve shows full out-of-sample results, where all parameters were tested. From 2020 to 2023, the performance is completely out of sample, so the confidence is higher.
- You re-optimize the strategy every three months, which helps it adjust to recent market conditions instead of relying on one long backtest from the last five to ten years.
Let’s understand this with an example.
9.20 Straddle variation base strategy
this strategy is created on the Algotest platform. You get 25 free backtests every week.
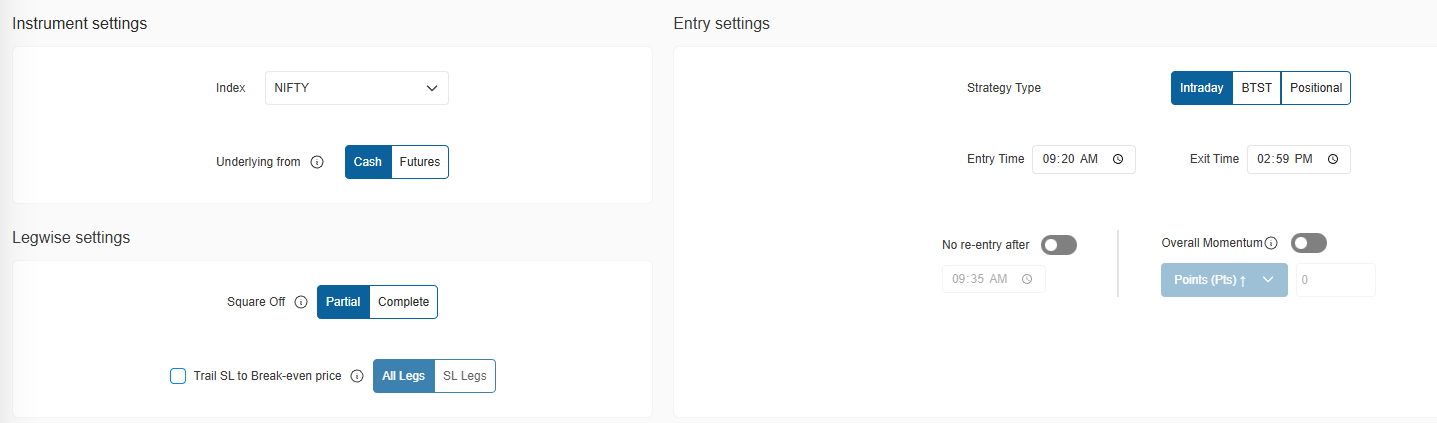
Base Strategy Rules
Index: Nifty
Entry time: 9.20 AM
Exit Time: 2.59 PM
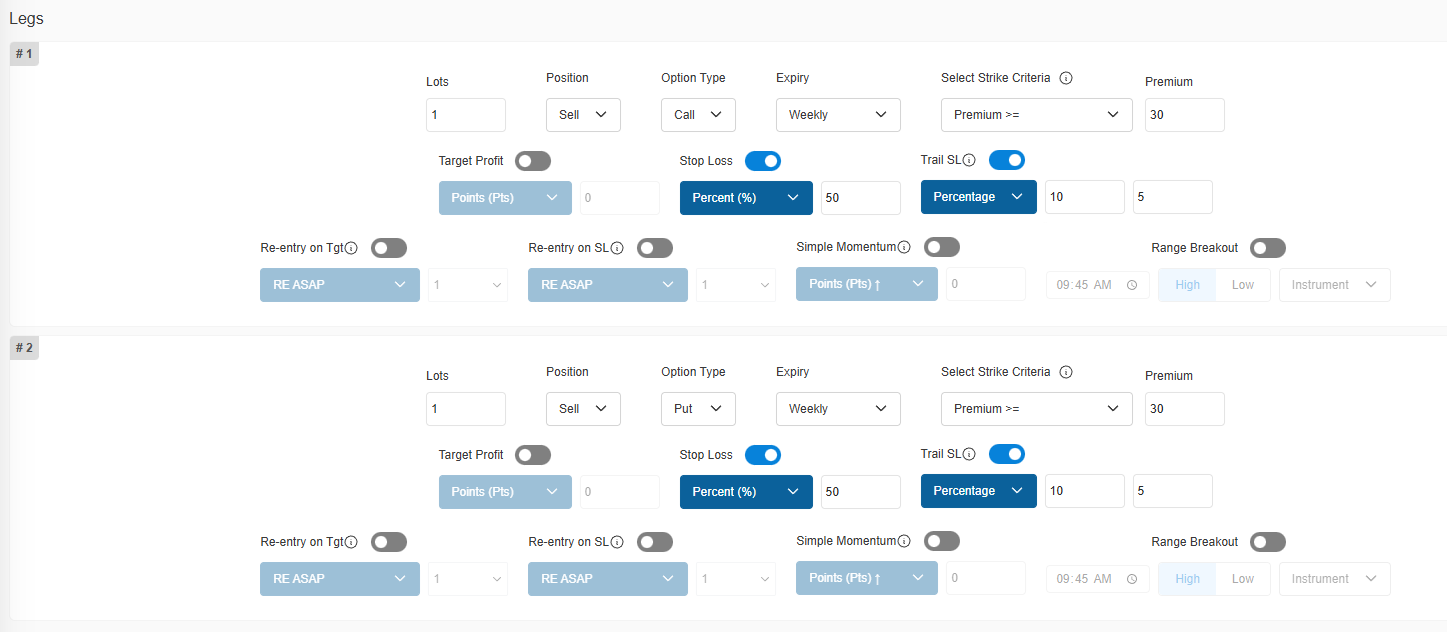
- Leg1: Sell CE with closest premium greater than 30
- Leg2: Sell PE with closest premium greater than 30
Stop loss for both legs is 50%
Trail SL: 10% and 5% (each 10% move in your favor shifts the stop loss by 5%)
Trade only on DTE-1 and DTE-0 (expiry day and the previous day)
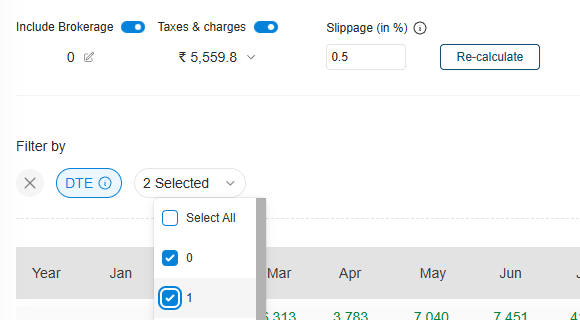
Slippage is set to 0.5 percent and all charges are included except brokerage. I use Kotak Neo, so brokerage is zero. In the DTE filter, I select 0 and 1.
Strategy Optimization
For the current strategy, these parameters were chosen after testing them again and again from 2019 to 2023. I have not changed any of these parameters after 2024.
entry_times = [dt.time(9, 20), dt.time(9, 45), dt.time(10, 30)]
premiums = [30]
sl_percents = [30,40,50,60,70]
Paratmers for walk forward optimization
In sample months = 12
Out of sample months = 3
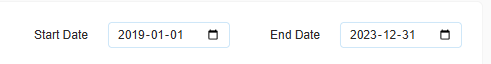
start_date = dt.date(2019, 1, 1)
testing_end = dt.date(2023, 12, 31)
True_validation_end_date = dt.date(2025, 11, 30)
Results Comparison
1. Base Strategy Results
2. Walk Forward Backtesting Results
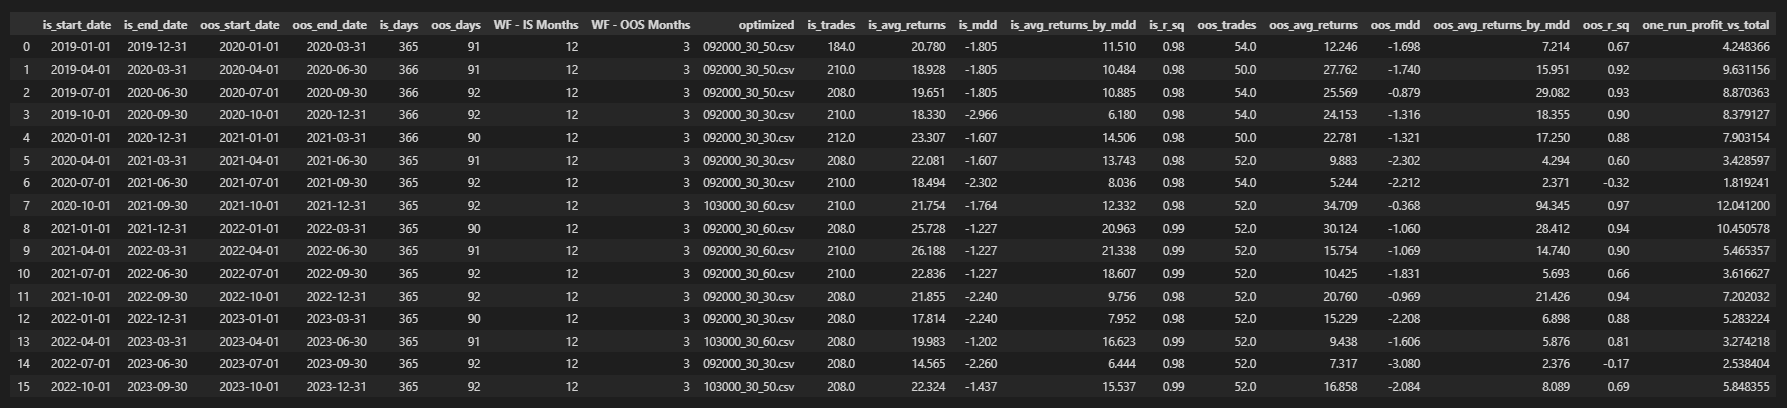
The optimized column in the table shows the optimized parameters for each period. They are listed with underscores in the format entrytime_premium_SL%.csv.
How to read it: In the first row, the in-sample (IS) period runs from January 2019 to December 2019. The out-of-sample (OOS) period runs from January 2020 to March 2020.
In the in-sample period, there are 184 trades with a annual return of 20.78%, a drawdown of 1.8%, and a return-to-drawdown ratio of 11.5.
When the same parameters are used on the out-of-sample period, there are 54 trades with a return of 12%, a drawdown of 1.67%, and a return-to-drawdown ratio of 7.2.
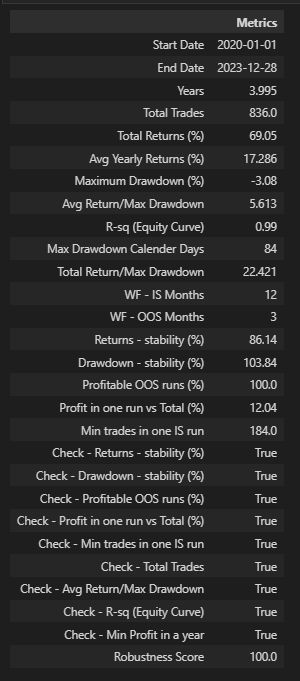
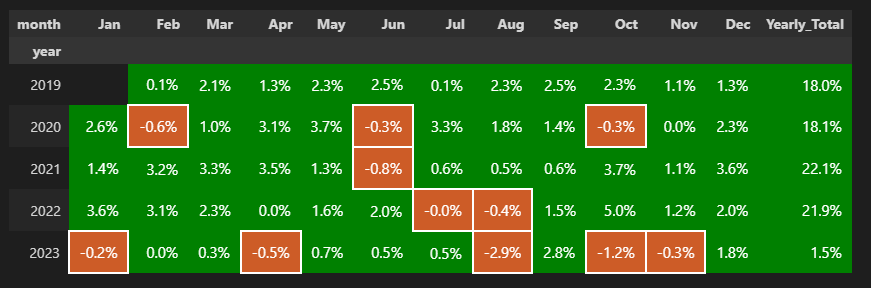
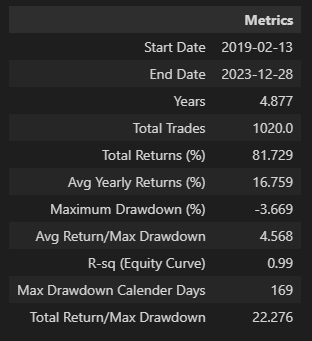
The return to drawdown ratio improved from 4.568 to 5.613 using the walk forward method. All quarters are profitable, and we now have stronger confidence in the strategy because each in sample optimization is producing positive out of sample returns.
Results comparison: Base strategy and Walk Forward Backtesting Results
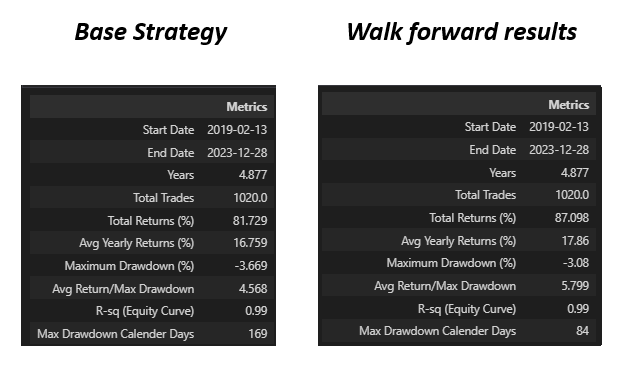
With walk-forward backtesting, the annual return improves along with the return-to-drawdown ratio. It also reduces the chance of overfitting.
Now, lets see how it performed in true test of future period
Walk forward Results including 2024 to 2025:
[Below content is only visible to members, membership is free]
![[Python Code] What's the BEST Way to BOOST Your Portfolio with Python](/content/images/size/w600/2025/07/How-I-Optimized-My-Portfolio-to-Beat-Nifty-50---23--CAGR-with-Python-1.png)